AVC Dashboard

India’s agricultural value chain: who gains, who stays poor.

Our agent-based model follows 10,000 rural households over 50 years. It compares PM-KISAN, fertiliser subsidy, crop insurance and direct cash transfers under historical and more severe climate.
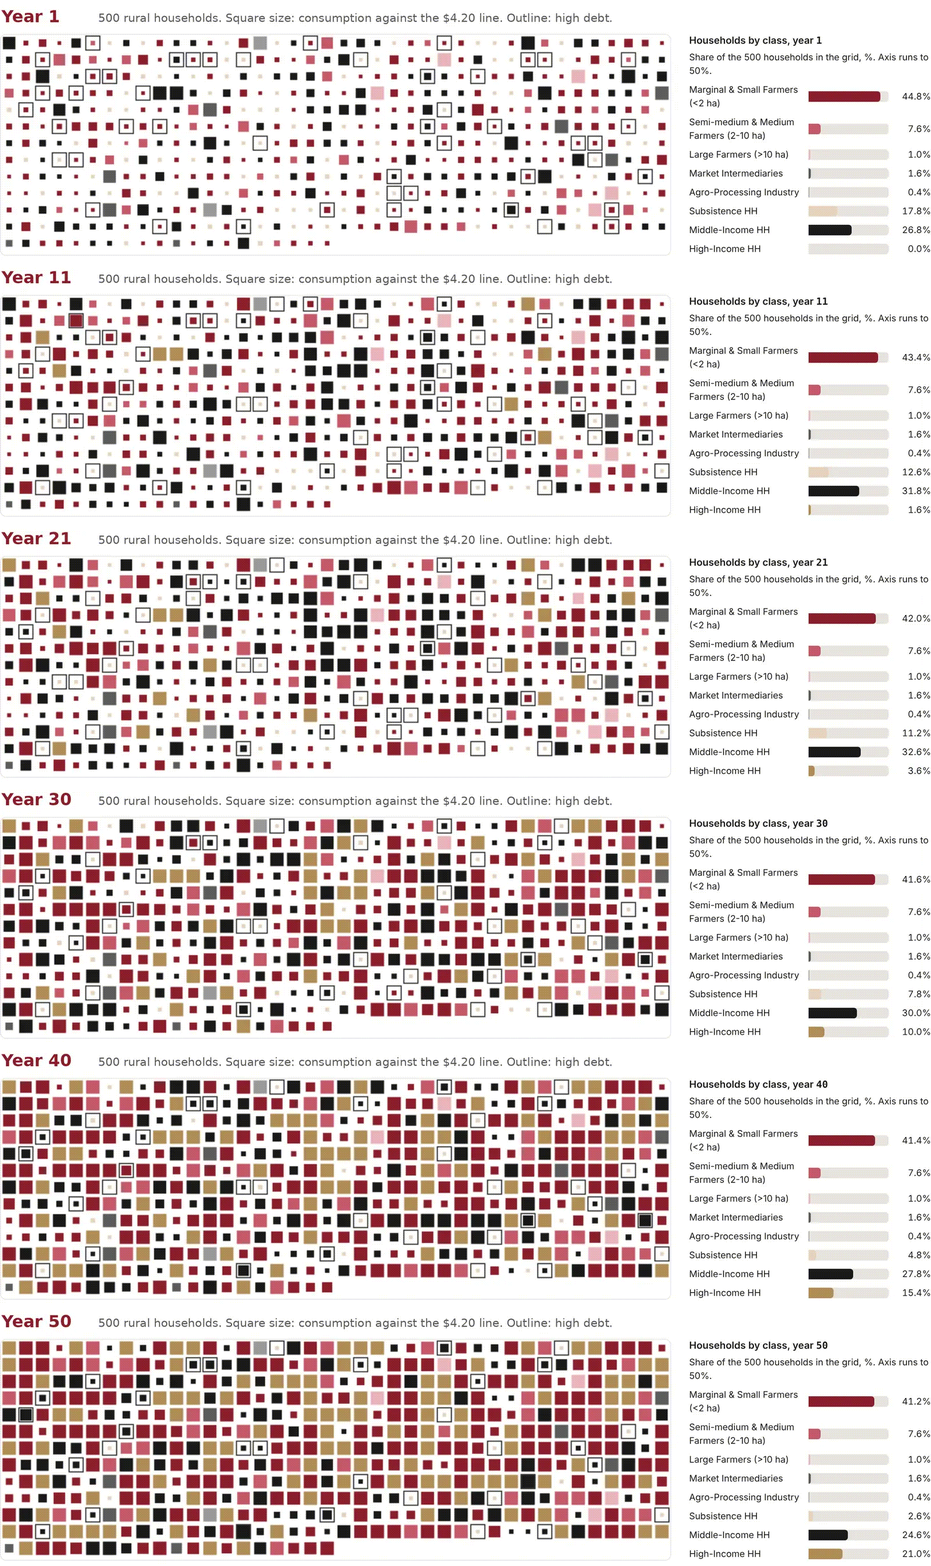
Animation of the agent grid: 500 rural households shown as coloured squares by class over 50 years, with a bar chart of the share of each class. High-income households grow and subsistence households shrink.
500 households from one run, current policy package, historical climate. Square size shows consumption against the $4.20 line.

Explore the dashboard

Choose a policy, a climate scenario and a lever. Poverty, inequality and farmers’ share of the consumer rupee update across all 50 years.
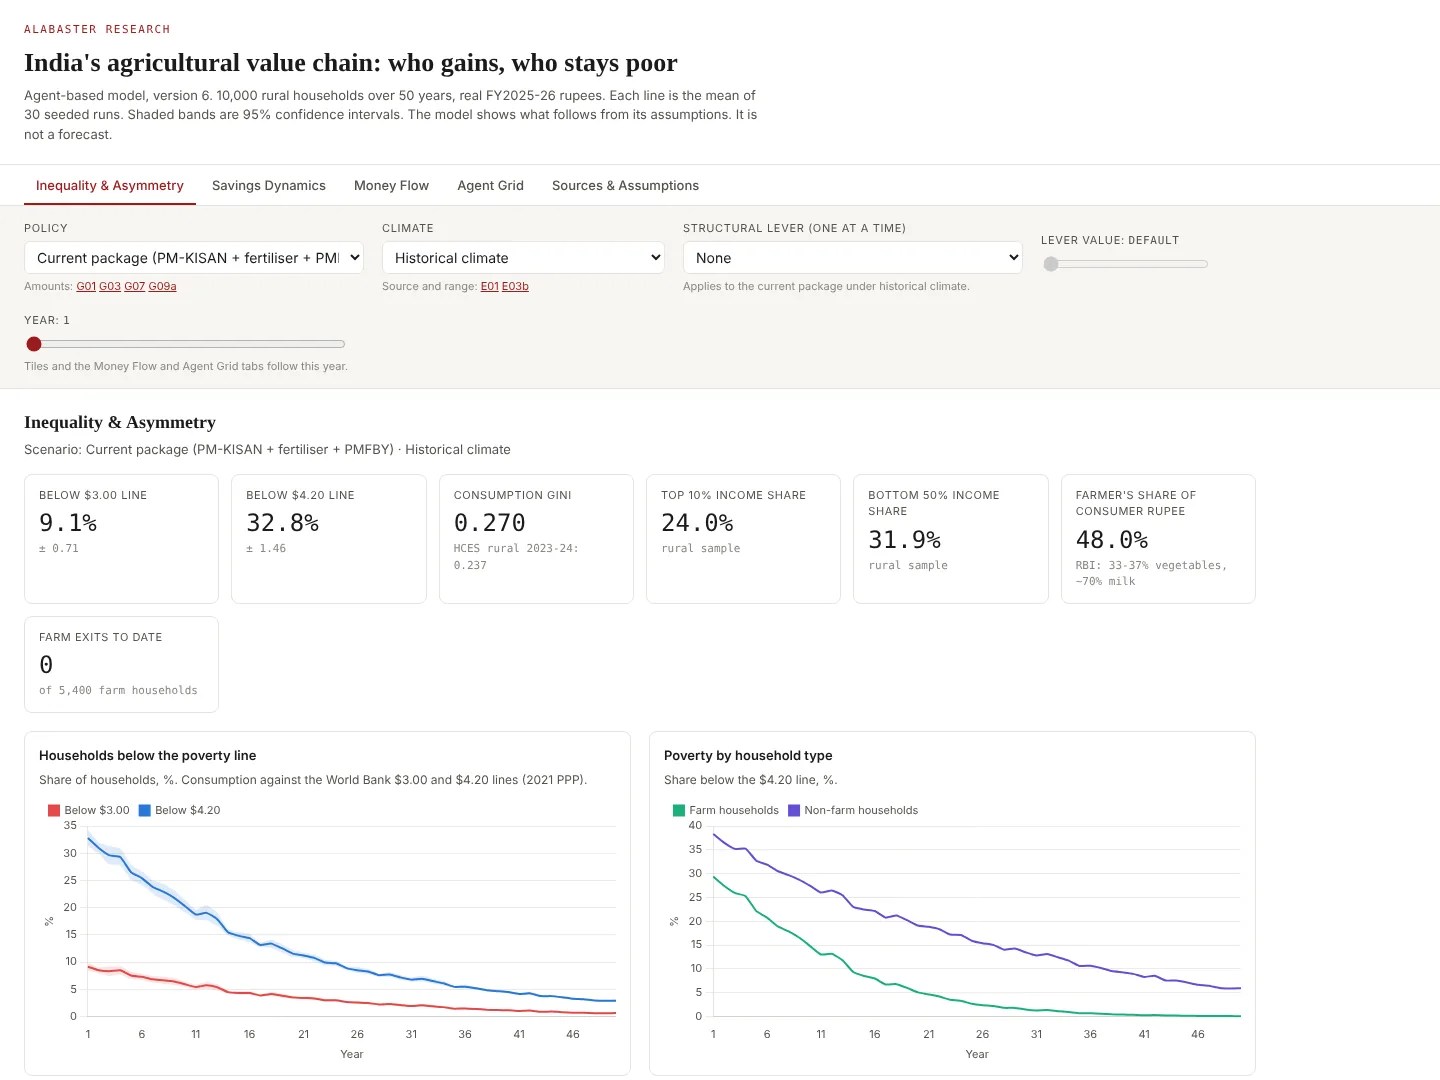
Screenshot of Alabaster's agricultural value chain dashboard, showing policy and climate selectors, headline poverty and inequality indicators, and charts of households below the poverty line over 50 years.